One economic counterweight
I used estimated net profit alongside sales to avoid rewarding growth without margin.
Business Intelligence · Profitability
A monthly operating view that turned scattered data into decisions about what to scale, defend or correct.
01
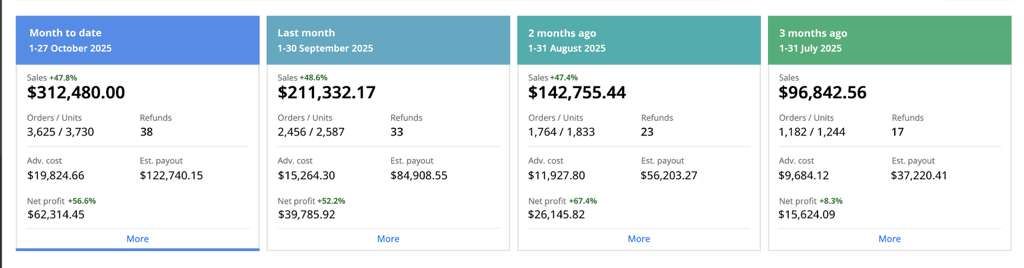
An ecommerce portfolio anonymized for confidentiality, observed from July through October 27, 2025 in Sellerboard. The objective was not another dashboard—it was understanding what explained the economic outcome.
Brand anonymized for confidentiality. Results observed in Sellerboard; the October cutoff covers 27 days and is not a complete calendar month.
02
Sales growth could look healthy even when products depended too heavily on advertising, discounts or insufficient margin. Without a combined view, volume risked being confused with profitability.
I organized the reading by month and connected sales, media spend, costs, refunds and estimated net profit. I then separated traffic, conversion, media-efficiency and economic constraints.
03
I built the monthly view, defined diagnostic criteria and prioritized actions by product. Final inventory and operational decisions were coordinated with the account team.
04
I used estimated net profit alongside sales to avoid rewarding growth without margin.
I separated demand, conversion, media and cost problems instead of applying the same fix to the full portfolio.
I classified products by opportunity, risk and real capture capacity—not revenue alone.
I documented consistent cutoffs and flagged that October contained 27 days to avoid a misleading comparison.
EVIDENCE
05
The portfolio moved from $96,842.56 in sales and $15,624.09 in estimated net profit in July to $312,480 and $62,314.45 at the October 27 cutoff. The system's value was making commercial and economic growth visible together.
Source: Sellerboard — Caso2.jpeg
06
A dashboard is useful when it changes decision order. The relevant question is not only what a product sold, but how much of that outcome remains defensible after media, costs and operational constraints.
Next step
I can build a view that connects sales, investment and margin to prioritize the portfolio with explicit criteria.