Purchase hierarchy
I organized each asset around a concrete question rather than repeating the product with aesthetic variations.
Data-to-Creative · Amazon Gallery
The documented improvement is not an invented percentage: it is a six-image system with stronger hierarchy, evidence and brand continuity.
01
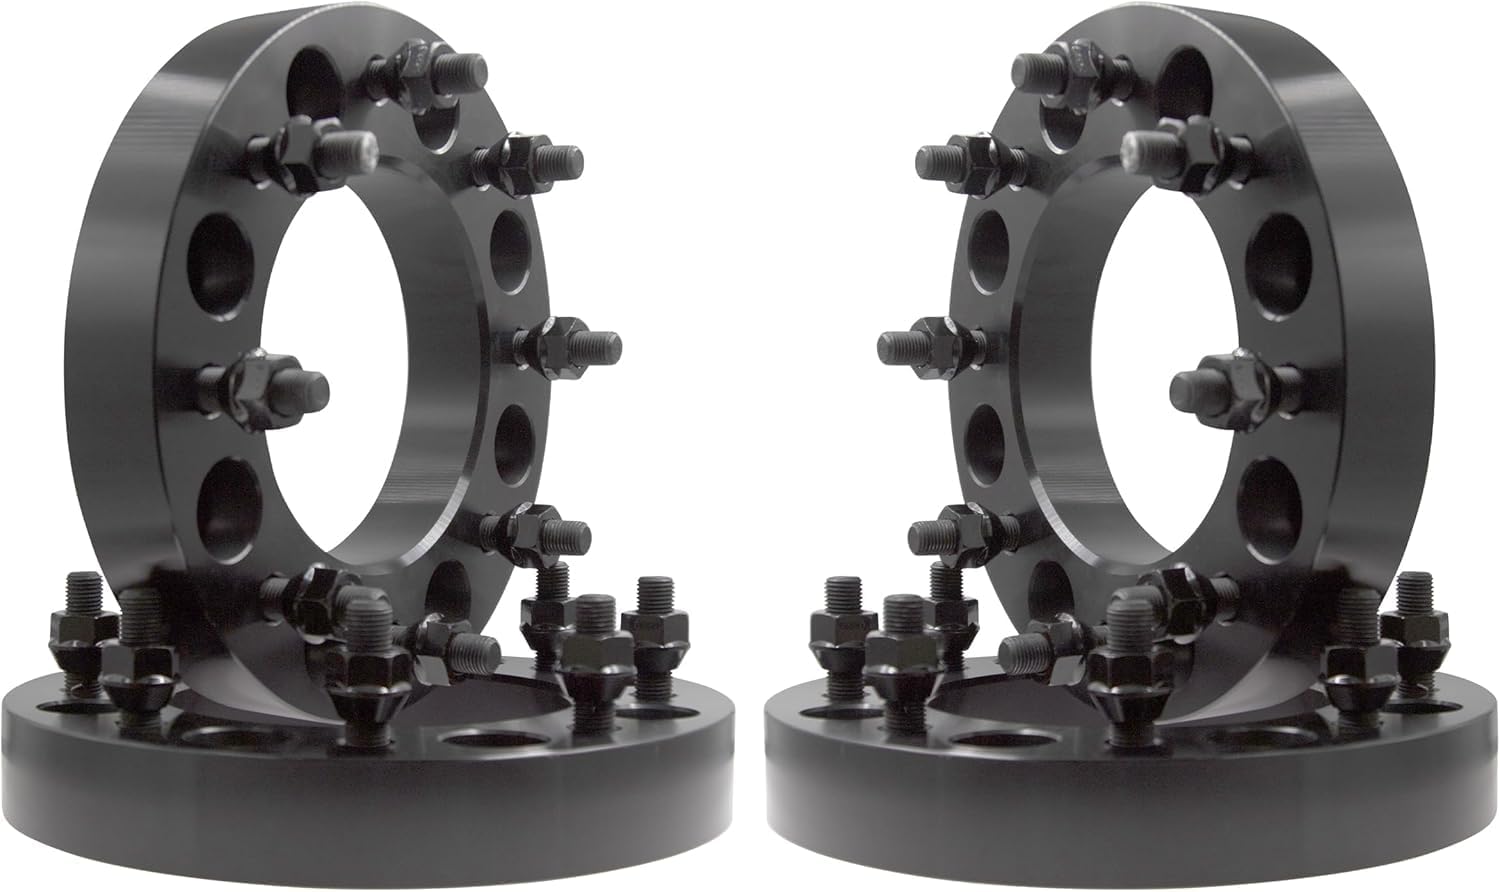
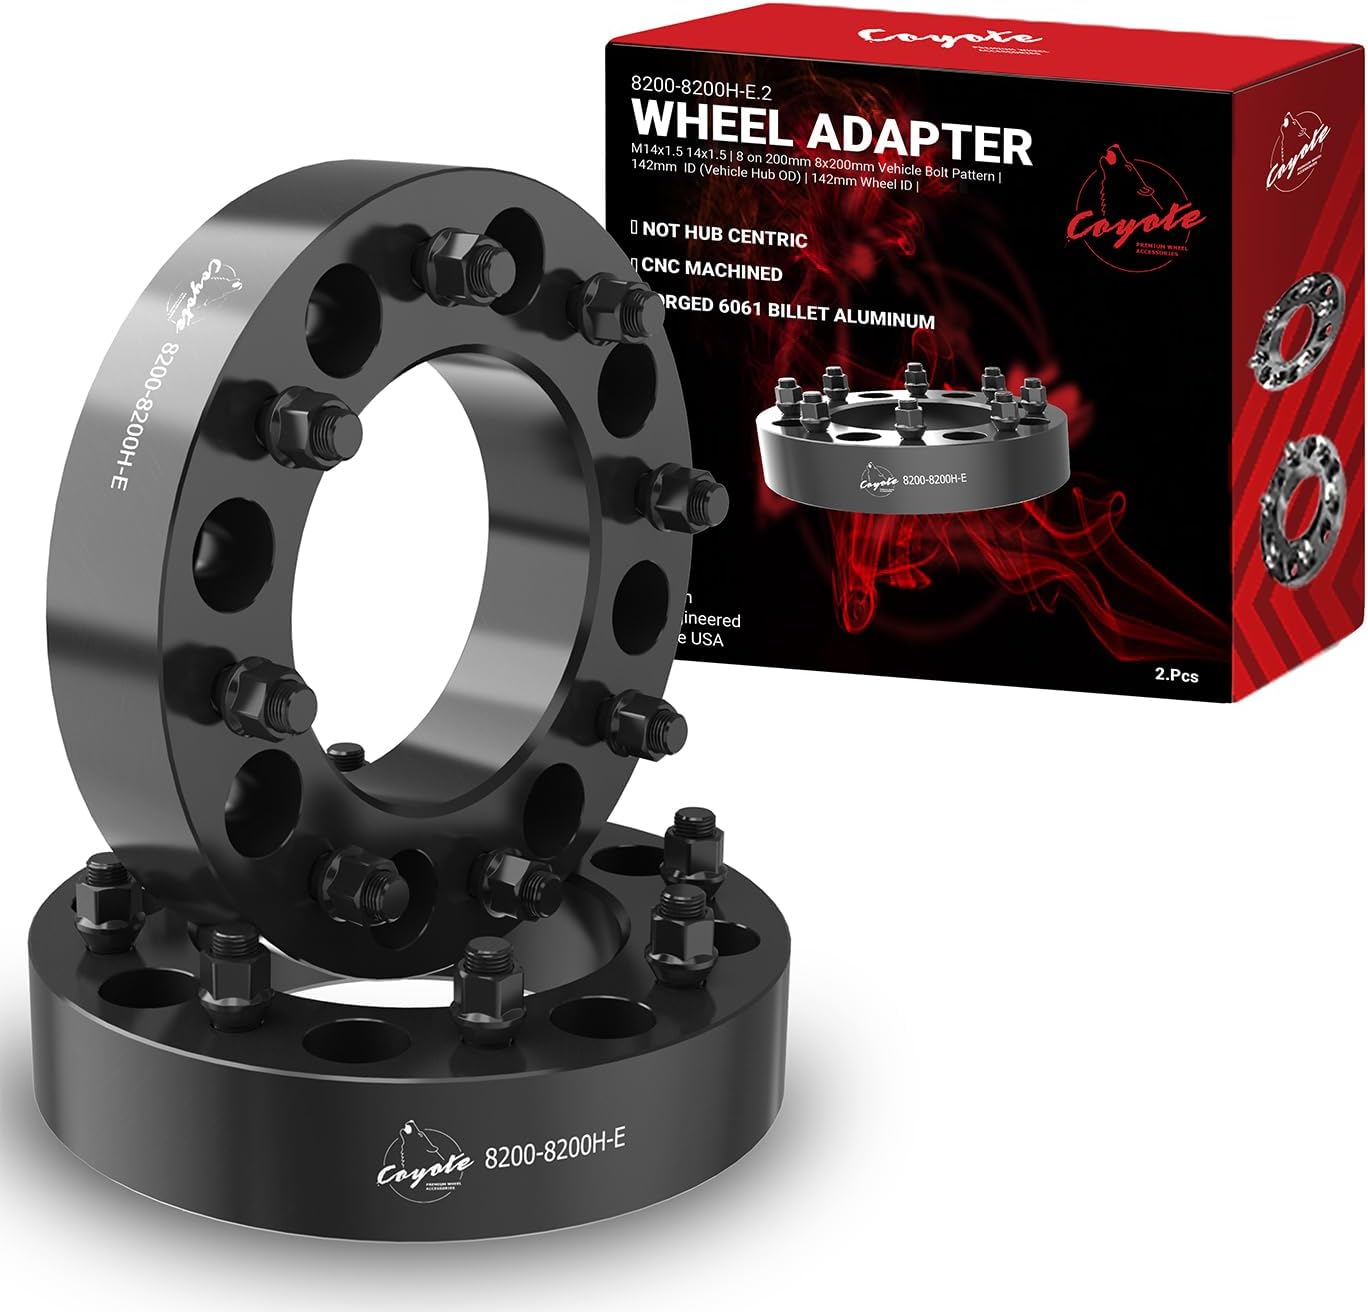
A technical Amazon product with a previous six-image gallery and a redesigned six-asset system. The archive contains before/after assets but no controlled conversion test.
The documented outcome is an improved communication system. No conversion impact is published because the archive contains no controlled experiment.
02
The previous sequence showed the product but left interpretation work to the shopper: specifications, compatibility and reasons to choose lacked a clear hierarchy.
I reviewed the gallery as a sequence of questions: what it is, what it works with, which problem it solves, how it is used and which evidence reduces purchase risk.
03
I audited the previous sequence, defined the message architecture and translated technical information into a modular visual system. I do not attribute a conversion change because that measurement is absent from the archive.
04
I organized each asset around a concrete question rather than repeating the product with aesthetic variations.
I integrated technical data and compatibility into readable compositions without relying on secondary text.
I unified typography, color, packaging and framing so the six images worked as one narrative.
I separated what the assets demonstrate from performance hypotheses that require later testing.
EVIDENCE
05
The deliverable moved from six low-information cutouts to six assets designed to explain and differentiate. The verifiable outcome is communicational; conversion remains a hypothesis to measure.
Source: Revolution/Old Style Images y Revolution/New Style Images
06
Data-to-Creative does not mean filling an image with numbers. It means deciding which information reduces uncertainty, in what order and with what visual evidence.
Next step
I can translate VOC, specifications and performance into a visual architecture ready to produce and measure.