Negatives before budget.
How a search-term audit of a 600-campaign Amazon Ads account found that negative keywords, not more spend, were the biggest efficiency lever.
Matías Gaglio ·
Leer en español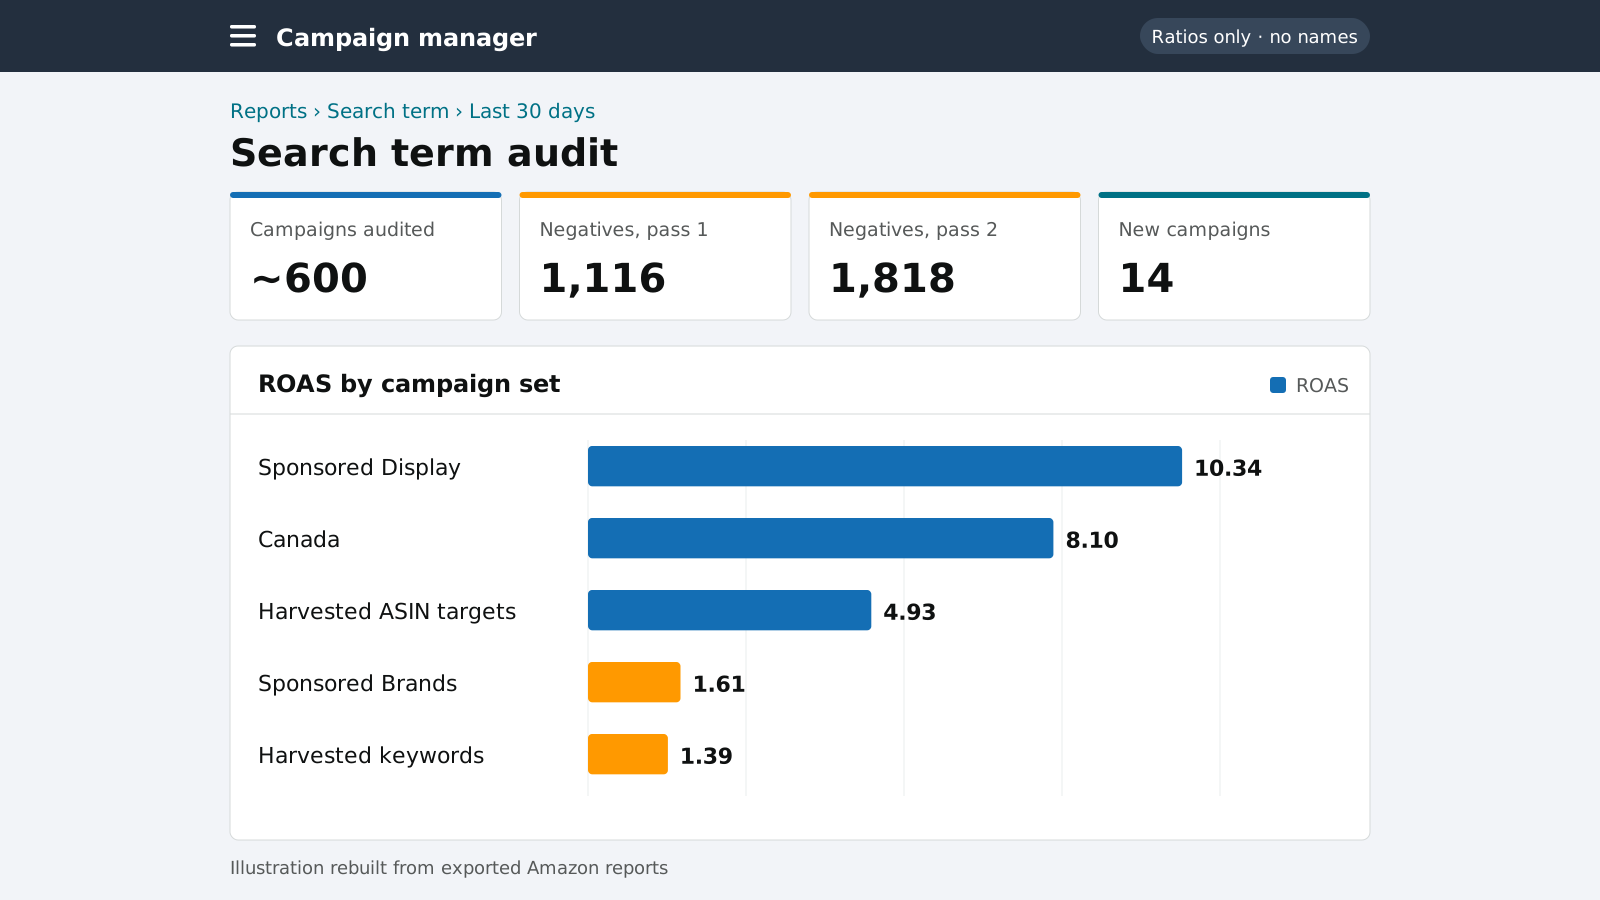
Where is the money leaking before we spend more?
The brief was clear: grow Revolution Supply's Amazon sales toward a daily floor, lift blended ROAS to 6.0 or more, and don't lose more than 10% of ad-attributed sales on the way. Management had also set a daily ad spend target. The easy reading was "spend up to the target". I wanted to know first where the current budget was being wasted, because new money poured into the same structure would leak the same way.
So the audit started with search terms, not campaigns. A campaign's ROAS is an average of good and bad searches. The search term report shows which queries actually bought something.
Six reports, four questions.
Search terms
30 days of queries with spend and orders, across Sponsored Products, Brands and Display. This is where negatives come from.
Targeting
Keywords and product targets by match type, to see whether a bad query came from a broad keyword or a loose product target.
Campaign and budget
Which campaigns run out of budget, which never spend, and how the daily account cap shapes delivery.
Business Reports
Total sales, sessions and conversion, so ad efficiency is read next to TACoS and the business as a whole.
Every finding went into one of three buckets: block it (negative), move it (harvest into its own campaign), or fund it (shift budget toward it).
Ad types weren't equal, and averages hid it.
Split by ad type and source, the 30-day search term data showed a wide spread. Sponsored Display earned more than six times what Sponsored Brands did per dollar. Harvested keywords had stopped working while harvested product targets were still healthy.
| Campaign set | ROAS | Read |
|---|---|---|
| Sponsored Display (search terms, 30 days) | 10.34 | Strongest ad type. Fund it. |
| Canada campaigns | 8.1 | Separate budget pool and underfunded. Fund it. |
| Harvested product targets | 4.93 | Healthy. Keep it. |
| Sponsored Brands (search terms, 30 days) | 1.61 | Main inefficiency. Block and cut. |
| Harvested keywords | 1.39 | Stopped. |
1,116 negatives first, 1,818 more second.
The first pass built 1,116 negative keywords and product targets: mostly queries that had collected clicks and spend over 30 days without a single order. Re-scoring the campaign pool without that waste moved its projected ROAS from 4.64 to 5.88 at the same spend.
A second pass went deeper into Sponsored Brands, where broad traffic was concentrated, and produced another 1,818 negatives.
Move
The other side of the same report is the search terms that worked. 14 new campaigns were built from queries with high ROAS that were buried inside broad campaigns. In their own campaigns they get their own budget and bids.
Fund
Budget moves toward Sponsored Display, Canada and product-target harvests. Those moves depend on raising the Sponsored Products daily account cap, which was already limiting delivery.
A spend spike traced to three campaigns.
Cleaning an account once isn't enough. In early November daily spend jumped, and the search term data traced most of it to three Sponsored Brands campaigns returning between 1.4 and 2.4 ROAS. The proposal followed the same rules as everything else: pause the one below 1.5, cut the other two hard, and negate the queries that weren't converting. Because the decision came from the rules, it took one review instead of a debate.
Better efficiency, not yet more demand.
4.87 ROAS
The most efficient ad month since March, on less spend than September and with no drop in sales.
40% → 49%
Ad-attributed sales as a share of total Business Report sales, August to early November.
About flat
Average daily sales in the 44 days after the change were within 2% of the 30 days before.
Negatives made each ad dollar work harder, but total sales didn't move with them. Ads now account for a bigger share of a business that is roughly the same size. That's why the next work moved from the ad account to the listings: traffic grew while conversion fell. I cover that in More traffic, less conversion.